
Housing Affordability & Macroeconomic Factors
This case study examines how mortgage rates, inflation, wage growth, and housing trends interacted to influence affordability pressure from 1991 to 2025.
Rezvan Heydari
Overview
This project examines housing affordability through a broader macroeconomic lens. Rather than looking at home prices alone, it brings together mortgage rates, inflation, wage growth, unemployment, home price growth, and affordability pressure to better understand how stress develops across the housing market over time.
The goal was to study affordability not as a single event, but as the result of multiple economic conditions gradually moving together.
Project Aim
This project aims to better understand how broader economic conditions shape housing affordability over time. In many discussions, affordability is reduced to one variable, but the real picture is more layered. Borrowing costs, inflation, wages, and labor conditions all play a role in how much financial pressure households actually feel.
By bringing these indicators into one analytical view, this case study makes it easier to see how pressure can build gradually before becoming more visible.
My Observation
What stood out most in this project is that housing stress rarely appears all at once. It tends to build quietly, through the combined weight of rising borrowing costs, persistent inflation, slower wage momentum, and elevated home prices. Looking at these patterns together made it clear that affordability pressure is usually not caused by one dramatic shift, but by several forces moving in the wrong direction at the same time.
That was the most meaningful takeaway for me. The value of this work is not in claiming a precise prediction, but in making pressure easier to recognize before it becomes too large to ignore.
Key Visual Findings
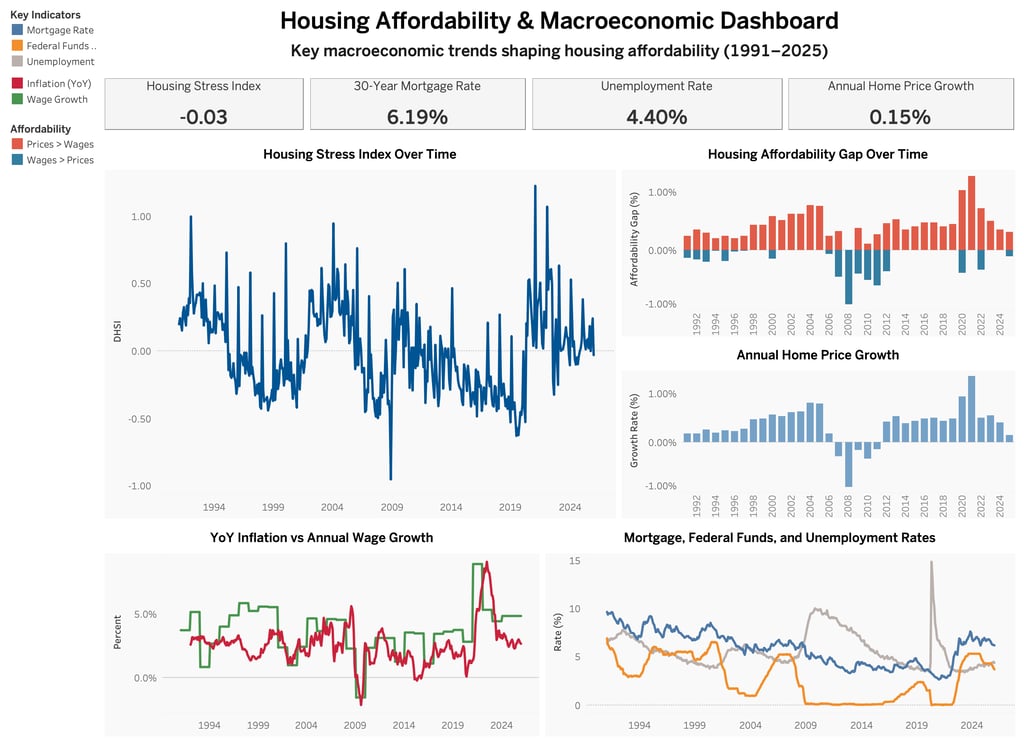
1. Housing Stress Index Over Time
The Housing Stress Index became the clearest summary of the broader story. It reflected how housing pressure strengthens when multiple economic conditions begin reinforcing one another. Rather than showing one isolated disruption, the index captured how stress can build gradually and become more visible only after several pressures are already in place.
2. Housing Affordability Gap Over Time
The affordability gap added an important layer to the analysis by showing how distance grows between housing costs and wage strength over time. What made this chart especially meaningful was not just the existence of the gap, but how it widened during certain periods and revealed how slowly affordability can erode. Even when changes seem manageable at first, the cumulative effect can become much heavier over time.
3. YoY Inflation vs Annual Wage Growth
This comparison brought the issue closer to everyday life. When inflation rises faster than wages, financial pressure builds even without one dramatic break in the market. This chart helped show that the challenge is not only about prices increasing, but about whether income can realistically keep pace with the broader cost environment.
4. Mortgage, Federal Funds, and Unemployment Rates
This view provided useful macroeconomic context behind affordability pressure. Mortgage rates and policy rates shape borrowing conditions directly, while unemployment adds another layer of economic stability. Together, these indicators helped explain why housing pressure can rise even when no single variable appears extreme on its own.
What This Project Suggests
This case study does not claim to predict exact market outcomes, and that is important. What it offers instead is a way to better recognize when pressure is building. The clearest takeaway from this work is that housing affordability tends to weaken when multiple economic forces begin working against households at the same time.
That makes broader pattern recognition more useful than relying on a single headline metric. Looking at these conditions together creates a stronger foundation for understanding when stress may be rising and why.
Tools & Data
Data Sources: FHFA, Freddie Mac, FRED, BLS, and SSA public data
Process: Data collection, cleaning, transformation, and dashboard design using public U.S. housing and macroeconomic data
Explore the full interactive dashboard on my Tableau Public page.
Explore More...
Finding Opportunity Across U.S. Housing Markets
An interactive real estate dashboard comparing U.S. metro markets by home value growth, new construction activity, and new-home price premiums to identify where housing opportunity may be emerging.
A Systematic Approach to Growing a Real Estate Portfolio
Growth in real estate is not just about buying more properties. The strongest portfolios are built through disciplined, repeatable decisions that create clarity, resilience, and long-term value.
Bringing together business strategy, real estate insight, and mortgage perspective through data-driven thinking.
Phone
hello@rezvanheydari.com
+1-404-798-4404
© 2025 Rezvan Heydari. All rights reserved.
Based in: Atlanta, Georgia, USA
Quick Links
Stay Connected
LinkedIn
Tableau Public
GitHub
Newsletter
Kasebin Business Hub